Measuring, tracking, and optimizing test
coverage is not an easy task for a test lead/manager in a team where multiple QA
Engineers are testing the product.
Telerik Analytics provide analytics driven
coverage by which manager, strategist or planner can get instant test coverage
and plan logical distribution of remaining test cases among the testers and
compiling results on the tested areas.
 In agile, It is not an easy task to track
what testing we are covering for each specific release(major/minor), what
scenarios were tested and what scenarios yet to be tested for that release?
In agile, It is not an easy task to track
what testing we are covering for each specific release(major/minor), what
scenarios were tested and what scenarios yet to be tested for that release?
Telerik Analytics provide version wise
tracking data(Click here to know how to versioning
your application ), so that we could find what was tested and what needs to be
tested for that release to QA signoff.
Sometimes, reporting test results can become a low-priority task when compared to test-execution activities. Without knowing the current test status, a project manager cannot take decisions to optimize the testing process, such as determine the test cases to stress on and identify the redundant test cases.
By using Telerik Analytics in the product,
manager can check the test coverage/status at any point of time and take
decisions on the fly without waiting till the end. It not only saves tester
effort, time and energy but also helps in improving product quality.
Telerik
Analytics for better QA:
Four main aspects one web application needs
to be tested before release are,
Functionality/Feature
Coverage Testing:
It is very important for QA not to miss any functionality testing before
signing off for the release. For small
QA teams it might not be much difficult but for large QA teams it would be a very
tedious to understand test allocation and hence there might be chances of missing
some functionality. Telerik Analytics provide a feature called “Feature Use”
where we can track down what all are the functionalities covered by the QA team
while testing. So that test manager can identify QA missed functionalities if
any.
Let us take an example application which
has three features (Feature-1, Feature-2 and Feature-3) and below is the
complete report collected from Telerik web client. By seeing below report/graph
test manager can easily identify that QA team tested two features (Feature-1
and Feature-2), missed one feature i.e. “Feature-3”. So that the test manager
can make sure that missed feature to be tested before signing off for the release.

Browser
Specific Testing: It is very important for QA to
make sure that the application to be tested in all application supporting
browsers and browser versions before signing off for the release. Telerik
Analytics monitor automatically takes care of getting browser information based
on which browser application logged in, we no need to specify any thing
explicitly to retrieve browser information. Below report saying QA tested
application only in Chrome (version 48) and Firefox (version 43), they never
tested application in remaining browsers like IE and Safari. Test manager will
plan accordingly.

Resolution Specific Testing: No one knows on which resolution customer uses our application hence
QA needs to be tested in all application supporting resolutions before signing
off for the release. Sometimes we can
observe that web applications does not render properly in some resolutions. For
web applications user experience plays key role hence, making sure that our
application render properly in all resolution is very important. For getting
system resolutions also, we no need to incorporate any special lines of code in
application, Analytics monitor takes care of it automatically.
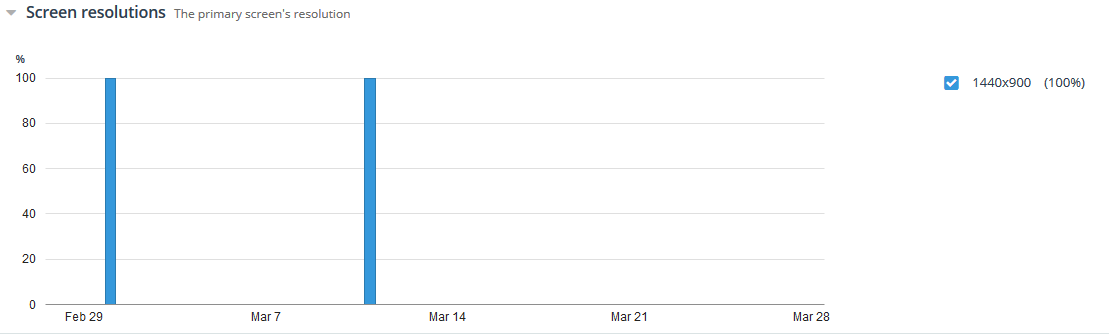
Above report says
that QA tested application only in 1440X900 resolution and never tested on
other resolutions.
Operating System Specific Testing: Till end customer uses our application we never know on which
operating system customer would like to access our application. So it is better
to test application at least once in all
supporting operating systems before QA signing off for the release. Telerik
Analytics monitor automatically takes care of retrieving OS information based
on application logged in system without any explicit coding.
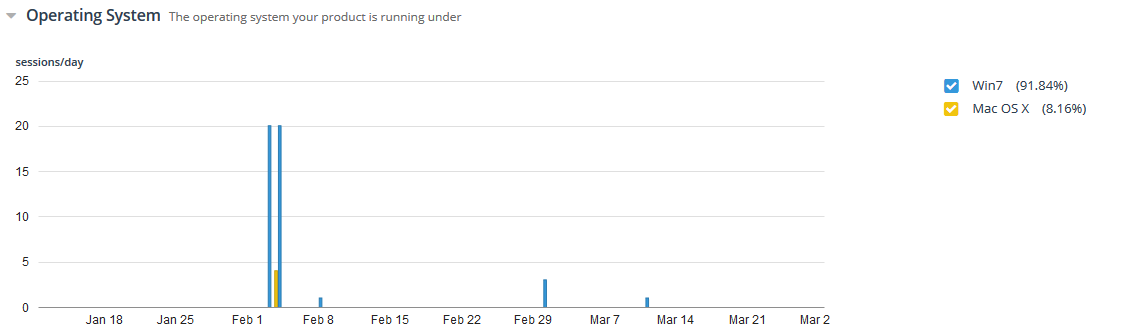
By seeing above
report we can say that QA tested application in Windows 7 and Mac OS X, they
never tested application in Windows XP, Vista and Linux etc.
In agile, organizations
generally release applications feature by feature in each release hence QA
needs to stress on releasing feature rather than released features. In such
scenarios, QA should not miss out any possibility of using that new feature by
the customer. QA should verify releasing feature in all supporting browsers, browser
versions, resolutions, operating systems
and all possible combinations of those. There is a possibility of
missing some test combinations if we are not maintaining test report properly.
Maintaining and reporting to test manager takes considerable amount QA time. Telerik
Analytics provide easy way to get those feature wise matrices so that QA no
need to maintain it explicitly and no possibility of missing any combination.
Let’s take an
example, organization would like to release “Feature-1” for “Application-1”. As
it is a new feature pushing into market, QA needs to test this feature thoroughly
before releasing to avoid customer issues. From the below report/graph it says
that, QA tested “Feature-1” only in chrome browser and yet to be tested in
remaining browsers like firefox, IE and safari.

Now a days pricing model plays key role in applications business. Same
web application render/work differently for different pricing type. Let’s take
a typical pricing model which has three pricing types (Basic, Professional,
premium), below status graph says that application has tested for both Basic
and Professional, never tested for premium type. With this type of information,
test manager can make sure that the application would be tested QA team for all
pricing types before releasing the application.

Some key advantages of using Telerik Analytics to
measure test coverage are:
- Test manager can get overall QA testing status report on the fly. No need to collect explicitly from each QA member.
- Data will be automatically collected and stored in the cloud, so no need to maintain explicitly.
- There is no possibility of missing any test coverage which essentially means that we can achieve 100% test coverage.
- It saves QA reporting time, hence QA can spend more time on testing rather than reporting.
No comments:
Post a Comment